
THIN ICE
- Stone Blue Capital
- Jul 19, 2023
- 4 min read
Updated: Jul 20, 2023
In a country fractured by wealth disparity a similar dynamic is forming within the stock market.
The six largest US tech companies have gained more than $3 trillion in market cap this year, leaving everything else far behind.
Consider:
This exceeds the size of US industrials and consumer staples sectors.
Surpasses all 2000 constituents in the Russell 2000 index.
Is larger than US materials, utilities, and real estate market sectors combined.
Is close to the market cap of the entire EuroStoxx50 index.
We’re running out of superlatives, but further consider this:
They drove 73% of S&P 500 gains in 1H23
Have a market capitalization nearly equivalent to half of US GDP
Trade at a price to trailing earnings ratio of ~ 40x, versus ~15x for everything else.
Is expected to represent all US corporate earnings growth and then some in Q2, versus a loss for the rest of the S&P 500. (Source: The Market Ear)
Bottom line: when the generals dominate the battlefield and the infantry is MIA, casualties tend to mount.
OUT-OF-SYNC US STOCKS HIDE MARKET RISKS (Reuters)
U.S. stocks' tendency to move in sync has plunged to near-record lows, but what might seem like a stock picker's dream may be a mirage, and investors may be in for a rude awakening.
S&P 500 correlation - a gauge of herd behavior, which measures how closely daily returns of index constituents align over a month - slipped to 0.22 at the end of June, close to the lowest since November 2021, according to data from S&P Dow Jones Indices. That means that many stocks are moving in different directions. (note: NASDAQ’s prior peak was also November 2021).
But with the bulk of the market's gains being driven by a handful of mega cap names and a crowd of market bets on continued low correlation, investors may be relying on a false sense of calm.
"The risk metrics that look quiescent and favoring idiosyncrasy may in fact be a chimera much more vulnerable to a macro shock than implied currently," said Arnim Holzer, global macro strategist at EAB Investment Group.
History suggests such narrow breadth can set the market up for a sudden surge of volatility.
"From these low levels of stock correlations, equity volatility has historically risen," UBS strategists said in a note recently.
Much of today's low stock market correlation has to do with the gulf in performance between a handful of mega caps driving the benchmark index higher and the rest of the market.
THE AI MEME
The current tech chase is about artificial intelligence (AI), the “next big thing.” How big a thing we shall see, but every mania contains a bit of fact and a lot of storytelling.
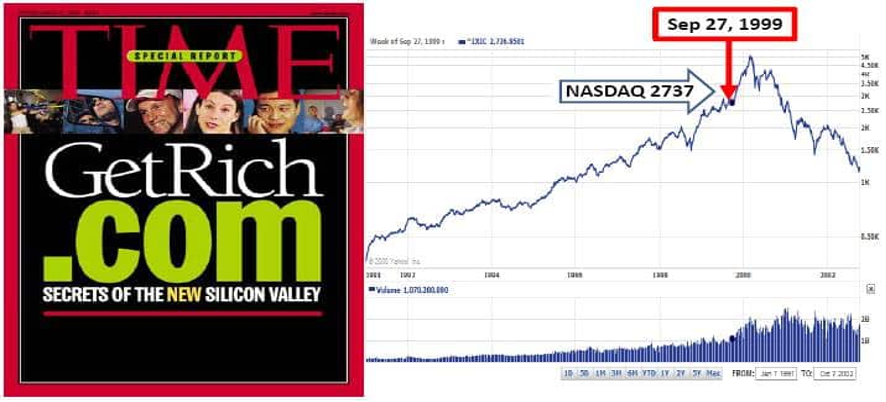
We saw much the same in 1999 as investors rushed to jump into the “internet boom” that would change the world.
What remains the same is that analysts, and investors, once again believe that “trees can grow to the sky.” Strong narratives like AI form market feedback loops built upon FOMO (the “fear of missing out”), something clearly present today.
Recall that market inflections always feature extreme psychological dissonance as investor sentiment becomes lopsided toward fear or greed.
The AI craze was recently discussed on CNBC, where Roger McNamee, the Silicon Valley legend, had this to say (via Herb Greenberg):
‘Today’s things they’re calling A.I., particularly the generative A.I.s – these are just B.S. generators, they have no verified content in them, and the results are totally unreliable.
The notion we will apply these to things like searches will result in one lousy outcome after another.
The guys at OpenAI [the company behind ChatGPT] are trying to create the illusion that their actions are inevitable. Yet there is no way to monetize this other than surveillance capitalism – [monetizing user data] – and we know from social media how much harm that causes.
What you’re looking at is a battle between the OpenAI guys trying to create this sense of inevitability and the market saying, “Wait, interest rates are now 5%, it costs half a billion dollars in parts [the cost of Nvidia’s A.I. Chips] to do each training session. That’s too high in a 5% interest rate environment when you have a business with no obvious business model.”
[Using chatbots] You have to do fact-checking on a search engine that defeats the purpose of a search engine. That isn’t progress.
While A.I. has enormous potential, the trick is you need to change the incentives. Executives who lead these projects are incentivized to protect those who use them and ensure that the content produces accurate results. Until you see those things driving the industry, the products will suck.’
‘THE ONLY CHART’
For years we’ve circulated ‘The Only Chart that Matters,’ here which tracks stocks versus the Federal Reserve’s balance sheet. As crises have mounted over the years, The Fed’s money printing resulted in higher stock prices. This formula dominated from 2009-2021, as shown below (SPX in purple, Fed BS in orange):

Note the peak in early 2022 as The Fed withdrew liquidity and hiked interest rates. Stocks, of course, fell sharply.
Also note the bottoming in March. Why? Another crisis forced The Fed’s hand, as they bailed-out regional banks in the wake of Silicon Valley Bank’s collapse.
As in 2020 when stocks soared while pandemic was still young, the only thing mattering was the marginal growth of money printing.
Now note that purple and orange are strongly diverging; the BS is falling but stocks are rising. Why? AI.
And on the chart below, this decoupling goes full MIND. BLOWN. comparing BS to the tech-heavier NASDAQ (NAZ in orange, BS in purple):

Going forward, BS is forecast to shrink further as $ trillions of new Treasury debt is issued to fund the debt-ceiling hike. Not too long ago, when the Treasury issued bonds The Fed gobbled it up, and the BS grew. Yet for now that’s not the plan.
Unless, of course, a fresh crisis arrives.
BONUS CHART:


Comments